Understand Anything
Read a project through its graph
Turn a selected codebase into a structural map, architectural layers and a reading tour, then check business flows and change impact against real source. It also maps a specific kind of Markdown wiki.
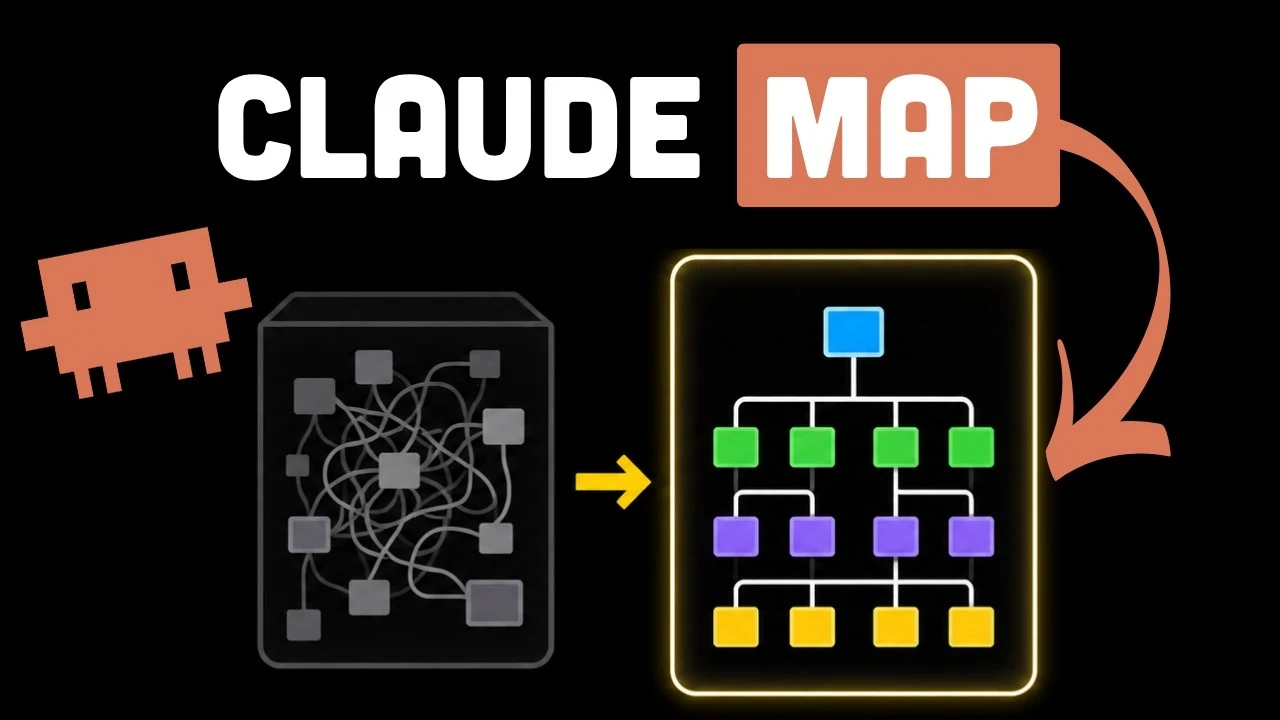
Understand Anything walkthrough
View example sourceHosts listed by the author
- Claude Code
- Codex
- Cursor
- Gemini CLI
- GitHub Copilot
- OpenCode
- Kiro
- Cline
- Antigravity
- OpenClaw
- Trae
- Hermes
- GitHub stars
- 88,943
- Version
- 2.9.8
- Checked
- Categories
- Engineering
Answer one real question before expanding the scope
Build a baseline for a small project, follow its tour to an entry point, and trace one actual flow in source. Once the graph helps you find the right files, use it for business explanations and branch reviews.
Pick a task and get started
Start Claude Code in the target project and run the commands below one at a time. Adding the marketplace is followed by installing its plugin. Choose the personal, current-repository option (local scope) in the installation panel, then follow its activation or reload message. Type / and confirm /understand-anything:understand is available before starting.
For joining a project and locating entry points, core modules and a useful reading order.
Install the complete Claude Code plugin
Run each line in a Claude Code session. The second opens the plugin’s install panel; choose local scope and finish installation. Follow the activation message and check for the namespaced commands. This installs the complete plugin, including skills, analysis agents and hooks.
Read the author’s setup guide/plugin marketplace add https://github.com/Egonex-AI/Understand-Anything.git /plugin install understand-anything@understand-anythingFirst run: confirm scope → build → open → check source
Send the first task from the selected project root. Review the data directory’s .understandignore before approving a full scan: .ua/.understandignore by default, or the file under an existing .understand-anything/. Check knowledge-graph.json, meta.json, fingerprints.json and warnings, then open /understand-anything:understand-dashboard ./. The dashboard first tries a viewer matching the installed plugin, then falls back to installing dependencies, building core and starting local Vite. At review, source was 2.9.8 while the newest public release was 2.9.0; no v2.9.8 viewer was found, so prepare the build environment. Use the complete token URL printed in the terminal and compare a graph node with its real source file.
Read the dashboard startup and fallback stepsGive your AI this first task
These are editorial examples, not results from a site test. Prepare brief.md with the project directory, revision, question and exclusions; include a base branch for change reviews. Here ./ means the current project. Replace the wiki path with your own material.
/understand-anything:understand ./ --language en --no-auto-update Analyze the current project using brief.md. First report the resolved target, revision, data directory and ignore rules, then wait for my scope confirmation. Disclose any redirection to the main checkout. Do not count excluded directories as covered. Report scanned and analyzed file counts, skipped files, failed batches and validation warnings, with paths to the graph, metadata and fingerprints. Open the dashboard only after final validation passes; identify partial output explicitly. Provide a reading path from project documentation through an entry point to core modules. Use the question in brief.md to select three real files and check the graph’s descriptions against their source. Separate parsed evidence, model inference and unchecked relationships. Keep automatic updates disabled and leave application code unchanged.
Check what you receive
- knowledge-graph.json in the project data directory, with meta.json and fingerprints.json when baseline creation succeeds; actual coverage and warnings included.
- A reading path linked to real files, at least three source checks, and questions the graph has not resolved.
More about this skill
Understand Anything combines local analysis tools, AI skills and a visual dashboard. The repository currently has nine skill entry points: understand builds a code graph and dashboard opens it; chat, explain and onboard support questions and reading; diff examines a change neighborhood, domain extracts business flows, knowledge handles Markdown wikis, and figma connects to a Figma file. You can start with the code graph without using every entry point.
The code graph connects files, significant functions and classes, configuration, documentation and infrastructure. Parsers supply structural clues such as internal imports and declarations; models add purpose, layers, tags and reading tours. A separate domain-graph.json organizes the code graph into business domains, flows and steps. That interpretation supports discussion, but is not an execution trace.
Artifacts live in the target project’s .ua/ directory, or its existing .understand-anything/ directory for legacy projects. Teammates can browse the graph and assistants can use it as context. Treat it as an explanation tied to a revision and scope, retaining exclusions, parse failures, inferred relationships and subsequent code changes alongside it.
Sources and verification
Sources checked
Based on the fixed commit’s nine skills, relevant analysis agents, wiki parser and merger, viewer and selected implementation paths, plus public release metadata and Claude’s plugin instructions. No installation, graph generation, model call or dashboard session was run by this site.